 For this project, I tracked the number of times I said “sorry,” the day that I said it, as well as the reason I said it.

For this project, I tracked the number of times I said “sorry,” the day that I said it, as well as the reason I said it.
Above is a table of data I collected about surfaces using the notes on my phone. I took the subject pretty literally, and I think that it might have been more interesting if I categorized it based on texture instead of material. I also could have assessed whether the materials used for surfaces were organic or man-made (such as plastic versus wood).
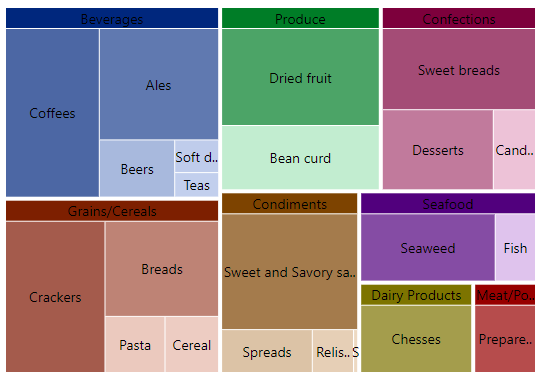
This example of a tree map is what helped me understand them most. The subject is easy to understand for anyone that has been grocery shopping or eaten food typical to the American diet. It’s a perfect way to further break down data.
